I’ve launched a project visualizing key economic factors like inflation, income, unemployment, job vacancies, housing, and mortgages. I’d be happy to share it with you; maybe you will find something interesting there too. It helps me stay updated on Canada’s economic trends, and if you’re in Canada or considering a move, you could discover insights in this report 🙂
You can find the report here: Living in Canada: Data-driven Perspectives with Power BI
To start with the report, let me ask you some questions.
- Have you noticed that prices for groceries, services, and other items have become more expensive this year? If so, how much have they increased in general? Have there been any instances of price decreases, and have things returned to normal?
- If you are currently employed or job hunting, do you think that people earn higher salaries in big cities or provinces compared to smaller ones? What is the job market like in terms of vacancies and unemployment rates in these regions?
- If you are in the market for a house, are you concerned about mortgage rates and house prices? How do they compare to prices from several years ago?
- If you are planning to relocate, are you familiar with the cost of living, transportation, and insurance in the new city you are moving to?
- Are the inflation rate and unemployment rate in your country following similar patterns to those in other top countries? Where does your country rank in terms of GDP, and has it maintained this position over time?
I know that we can dig up this info online or chat with the locals, but that might take a bit of time and effort to get the whole picture.
Regarding these curiosities, here are the findings I’ve discovered from the report. I think these insights are pretty interesting, so I wanted to share them with you.
- On the first page of the report: Overview
Canada’s GDP took a massive hit in April 2020, and it actually took about two years to bounce back.
I’m also curious how some other countries fared during this time, but we can dive into that topic later.

In May 2020, Canada hit its highest point of unemployment.
Unemployment was sky-high in 2020, but it’s been coming down. It might even seem normal compared to the years 2015-2019, but hold on, it’s not quite there yet. We’ll dig into this on the second page of the report.

Two years and one month later, in June 2022, inflation reached its peak.
Lately, the inflation rate has come down, but it seems like it might start going up again.

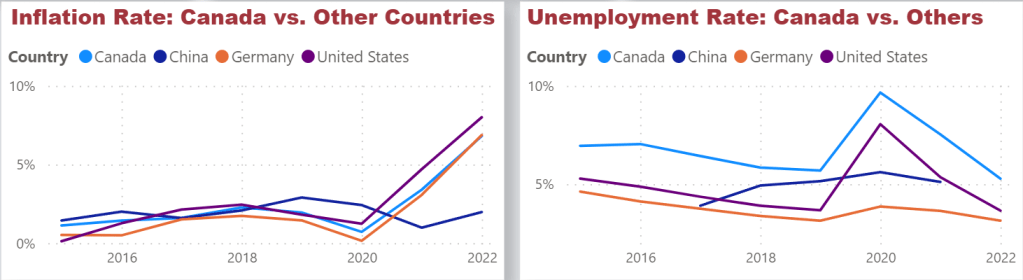
When you stack up Canada against some other top countries, you’ll notice similar patterns in inflation and unemployment rates compared to the US.
Looking at the period after 2020, Canada’s inflation rate is lower than the US, which is on par with Germany. However, its unemployment rate is higher compared to these countries.
2. On the second page of the report: Employment

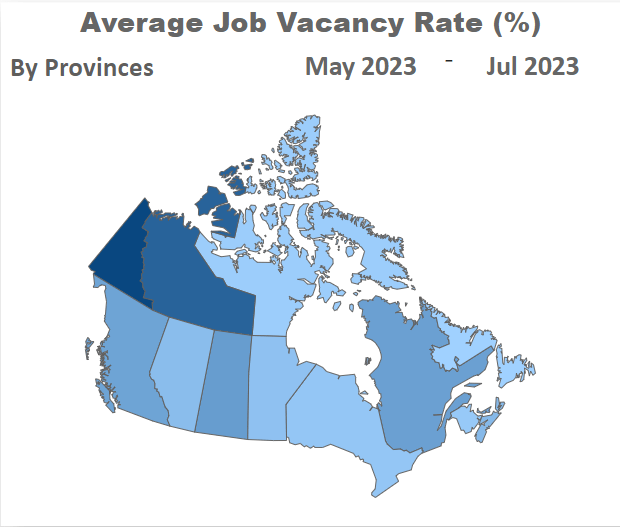
Checking out the data from recent months (May 2023 to August 2023), I noticed something interesting.
It’s not what I thought, but British Columbia, Ontario, and Quebec—where you’d usually find bustling cities like Vancouver, Toronto, and Montreal—aren’t the places with the highest income.
I was surprised that regions in the north, like Northwest Territories and Nunavut, actually have higher incomes.

And the same goes for job vacancies, which are also higher in these northern regions. That makes sense. Due to the frigid weather and limited infrastructure in these regions, not many people are inclined to live there. Those who do choose to reside in these areas should receive higher compensation.
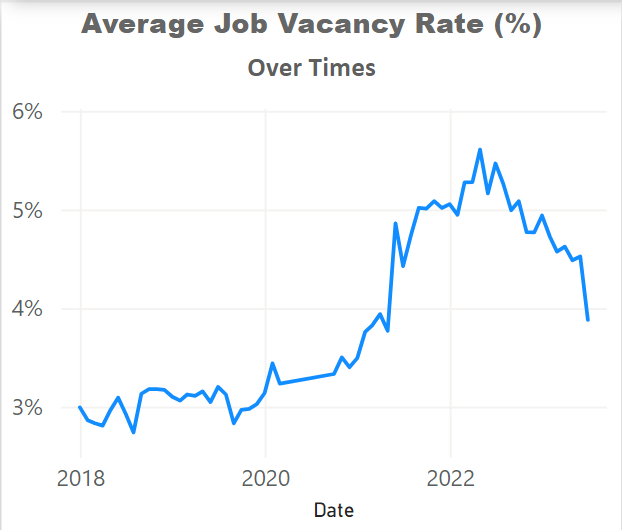
Taking a look at the period from January 2018 to August 2023:
Income took a noticeable jump in May 2020. Could it be attributed to government support?

Job vacancies saw a substantial rise from December 2020 to May 2022, few months after Covid-19 emerged.
They’ve declined since around the middle of last year.
The unemployment rate seems to have returned to normal levels since mid-last year. What are your thoughts on that?
I still have some concerns about the patterns of job vacancy rate and of unemployment rate. I’ll put these two rates in the same chart and take a look at it later.

Just a quick heads up, I’m no economist, but I’ve been poking around with the data and here’s what I’ve found.
If you’re interested in other aspects, feel free to let me know and find out together! It will be super fun!
And stay tuned for the upcoming segments about living costs, house prices, and much more!

Leave a comment